Continuing on my posts on Executive dashboards and Open source BI platform (specifically Pentaho), I would like to start with perhaps the most important graph component to start off an executive dashboard in my opinion - bullet graph. Conceived by Stephen Few in now a famous specification, bullet graphs get to the point without unnecessary frills.




In my previous
post, we had started building a BI dashboard using a 3 column
layout using the Pentaho BI Server. Luckily, out of the box bullet graphs in Pentaho community edition are already very compelling. In this post, we will customize
the Bullet graph to match the ideal look and feel that I wanted for
the dashboard utilizing customizations that are not that widely known.
Here is what I want my final bullet graph to look like.

Here is what I want my final bullet graph to look like.

We will start with the steps to create a simple bullet graph, followed by the steps to customizing it.
Creating the simple bullet graph
Adding a bullet graph in Pentaho BI
Server community edition is a simple task. First in the Layout view,
identify a column where we will drop our chart. To add a simple
bullet graph, switch to the components tab, navigate to the charts
section on the left and click on CCC Bullet Chart link.

Clicking on the link will add a new
chart component to our configuration. We can enter some details as
follows.
| Parameter | Value | Description |
| Name | SimpleBulletGraph | Name of the component instance |
| Width | 300 | Width in pixels |
| Height | 100 | Height in pixels |
| Bullet Title | “” | Title of the bullet graph. In case, the graph is created for multiple categories, one bullet title appears for each bullet graph. |
| Bullet subtitle | “” | Subtitle of the bullet graph |
| Bullet Measures | 90 | The observed measure for this performance indicator |
| Bullet Markers | 95 | A marker, such as a target value for this performance indicator |
| Bullet Ranges | [25,50,75,100] | A coloured range showing ranges of poor, acceptable, good and excellent values or similar to help the audience interpret the data. |
| Title | Simple Bullet Graph | A title for all the graphs. In case, the graph is created for multiple categories, one bullet title appears for all the bullet graphs. Usually appears on top of the graph. |
| HtmlObject | Panel_1 | Name of the placeholder for the graph. Clicking on backspace in the text input box, displays the list of available html containers. |

Clicking on preview, we can see how the
out of the box bullet graph looks like.

Customizing the bullet graph
We needed to customize the bullet graph
to make it match the overall site as well as apply some information
architecture principles.
These include the following changes
- Modifying range colors
- Modifying the marker symbol (target value)
- Modifying the bar color (measure symbol) based on value relative to scale
- Modifying scale look and feel
- Modifying look and feel of the measure value.
Modifying range colors and marker symbol
Lets add another bullet graph to the
second panel and set the properties very similar to our first graph.
| Parameter | Value | Description |
| Name | chtQualityOfLife | Name of the component instance |
| Width | 300 | Width in pixels |
| Height | 100 | Height in pixels |
| Bullet Title | “” | Title of the bullet graph. In case, the graph is created for multiple categories, one bullet title appears for each bullet graph. |
| Bullet subtitle | “” | Subtitle of the bullet graph |
| Bullet Measures | 90 | The observed measure for this performance indicator |
| Bullet Markers | 95 | A marker, such as a target value for this performance indicator |
| Bullet Ranges | [25,50,75,100] | A coloured range showing ranges of poor, acceptable, good and excellent values or similar to help the audience interpret the data. |
| Title | Quality of Life | A title for all the graphs. In case, the graph is created for multiple categories, one bullet title appears for all the bullet graphs. Usually appears on top of the graph. |
| HtmlObject | Panel_2 | Name of the placeholder for the graph. Clicking on backspace in the text input box, displays the list of available html containers. |

Now lets click on Advanced Properties
link for the chart configuration (note the position of the mouse
cursor in screenshot below).

This is what the screen looks like.

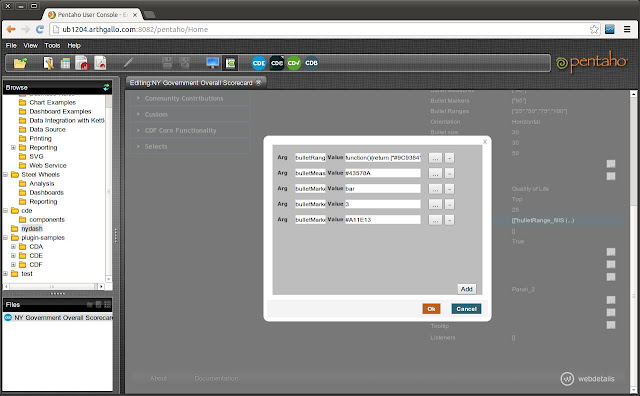
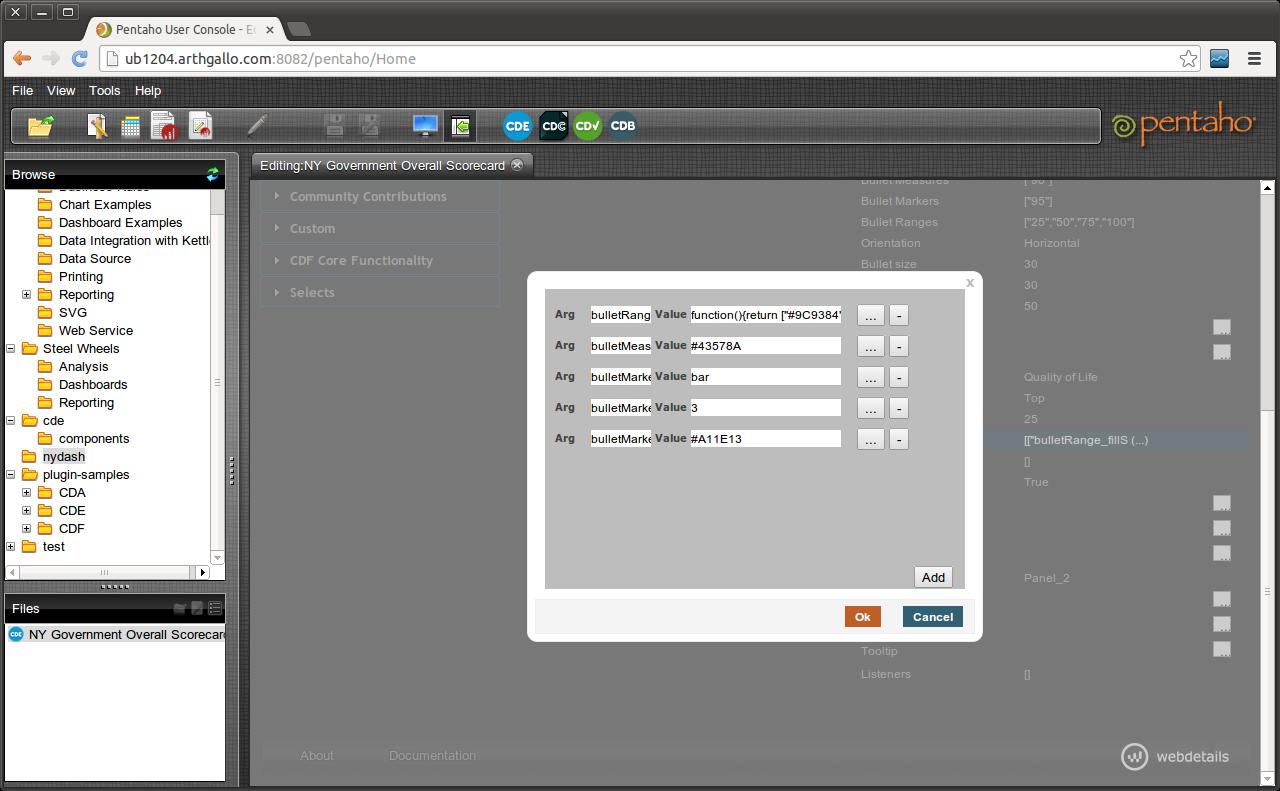
Click on the property Extension points,
and add the following entries.
| Parameter | Value | Description |
| bulletRange_fillStyle | function(){return ["#9C9384","#DED2A0","#F2EED5","#FEFDF9"][this.index];} | Changes the fill color for the ranges to a set of custom colors from the default grey. Note that number of elements in the array need to match the Bullet Ranges. |
| bulletMeasure_fillStyle | #43578A | Color of the bar |
| bulletMarker_shape | Bar | Shape of the Marker (Target) symbol |
| bulletMarker_lineWidth | 3 | Width of the Marker symbol |
| bulletMarker_strokeStyle | #A11E13 | Color of the line |
Saving these settings and previewing
the dashboard gives the following

Here is a close up of the updated
bullet graph.

In the next post, we will see how to apply conditional formatting to the same bullet graph to make some values stand out.


